Back

21 Feb 2020
USD/JPY Price Analysis: Dollar retreating from 10-month highs, trades below 112.00 figure vs. yen
- USD/JPY is retreating down after a volatile week.
- The consolidation might see USD/JPY trade sideways below the 112.00 figure.
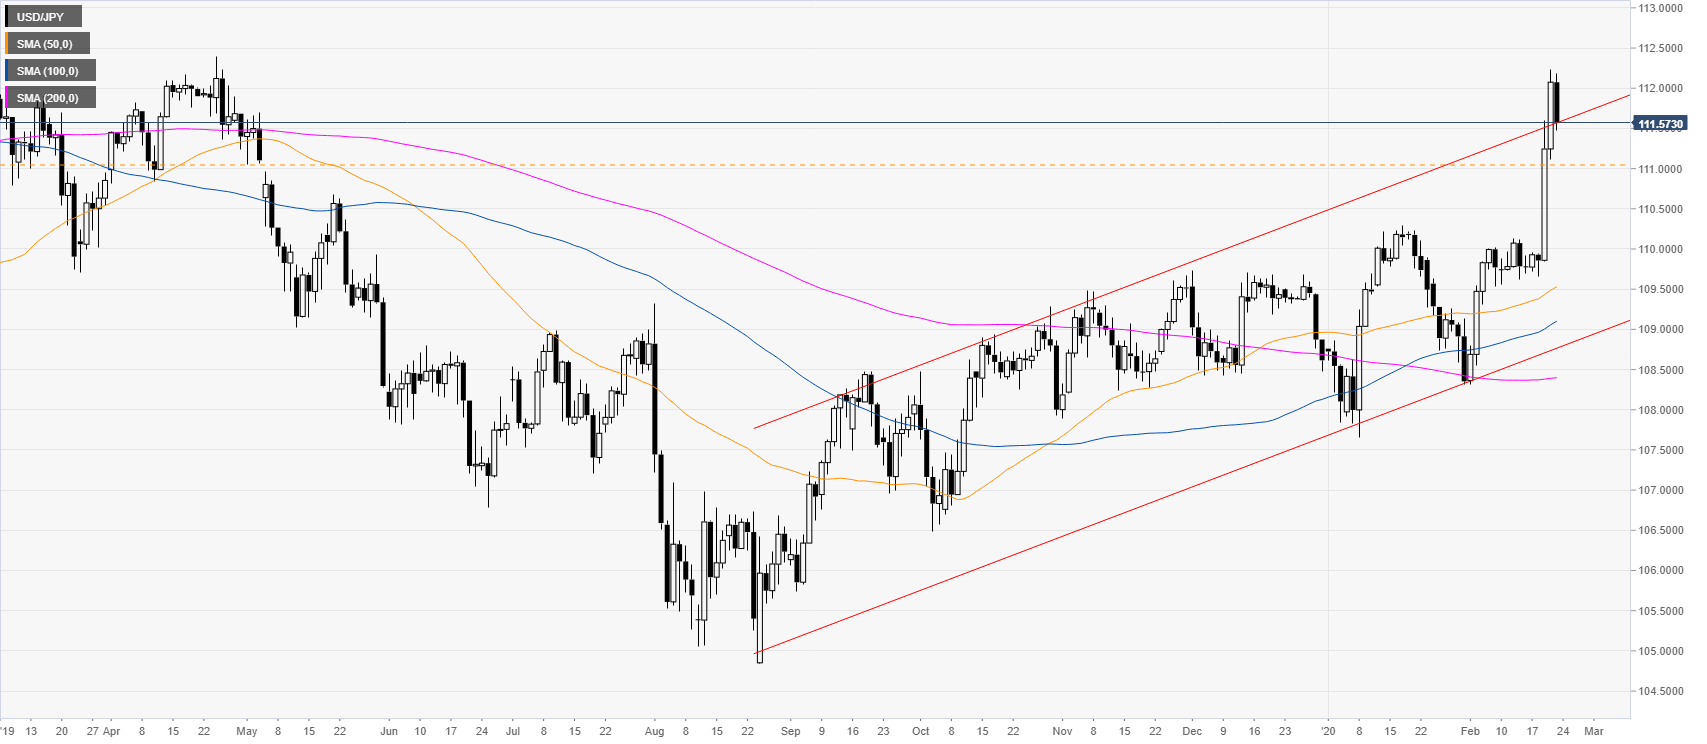
USD/JPY daily chart
Dollar/Yen broke above an ascending channel while above its main daily simple moving averages (SMAs). The spot is correcting down after two consecutive days of above-average intraday rallies.
USD/JPY four-hour chart
USD/JPY is starting to correct down after an unusual spike to the upside in the last two days. The market is seen going sideways below the 112.00 figure and potentially accelerate down below the 1117.17/110.71 resistance zone, according to the Technical Confluences Indicator. On the flip side, bulls are looking for a daily close above 112.57/91 in order to extend to bull move.
Resistance: 112.00, 112.57, 112.91
Support: 111.41, 111.17, 110.71
Additional key levels